When working with large numbers, understanding them conceptually is easy but understanding how big a large number really is, can be a little more elusive. For this project I wanted to work with the data of how many people have died from COVID-19, so that myself and others can concretely understand how many have been lost.
My idea is for this project to be a video installation that can serve as a type of memorial for those lost. On the left there will be four videos using found footage. Top-left, thunderstorm clouds representing the chaos of life. Top-right, rain falling on the ground to represent leaving the chaos. Bottom-left, the lily blooming representing the transition to the after-life. Bottom-Right, lilies moved by the wind to represent continued peace.
On the right side of the installation will be projected a large world map that over a few hours be filled with dots, each representing a death. Information from the John Hopkins Coronavirus World Map was gathered and inputed into a p5.js sketch that will add 100 dots to the screen per second. Originally I had planned to have the dots located in the approximate location of where a person had died but I worry that that would create more nationalistic/political feelings then unity in remembering the lost.
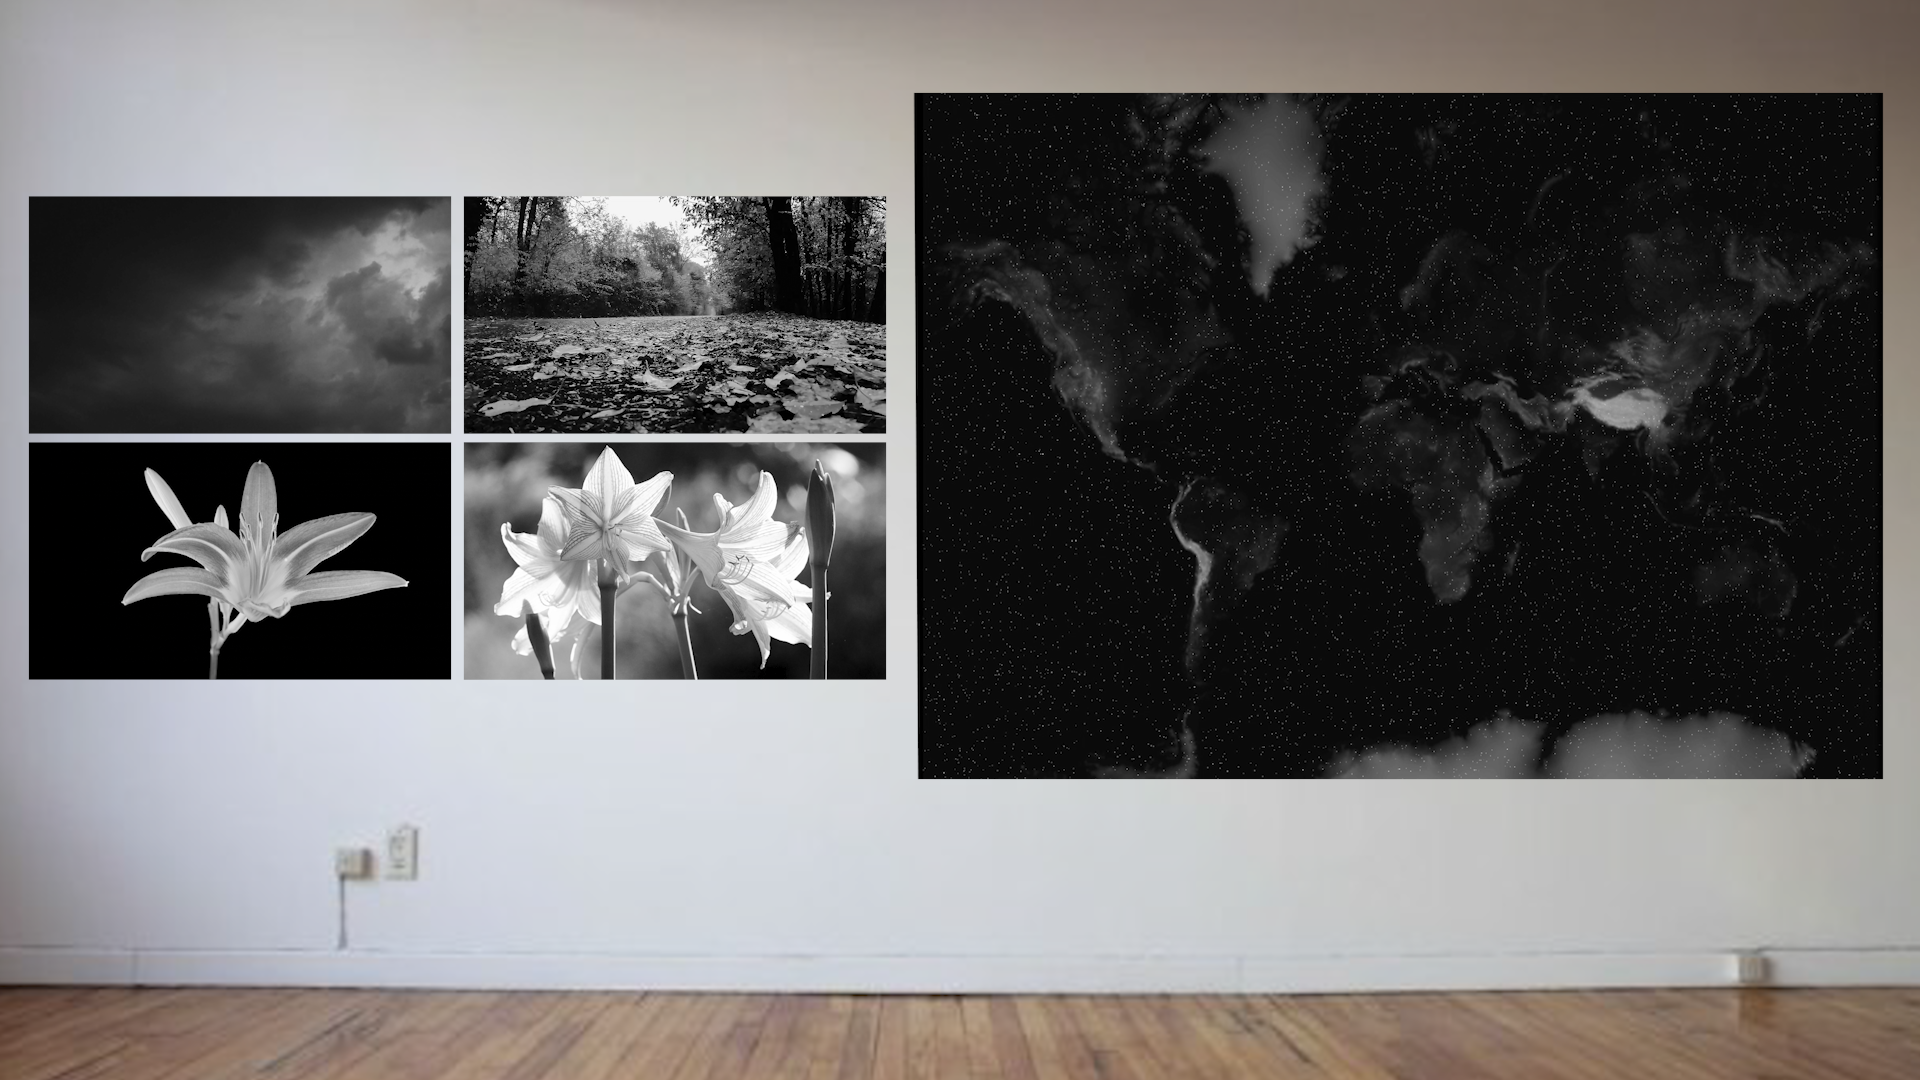
Gallery Concept Photo
Five Video Concept
2 Video Concept